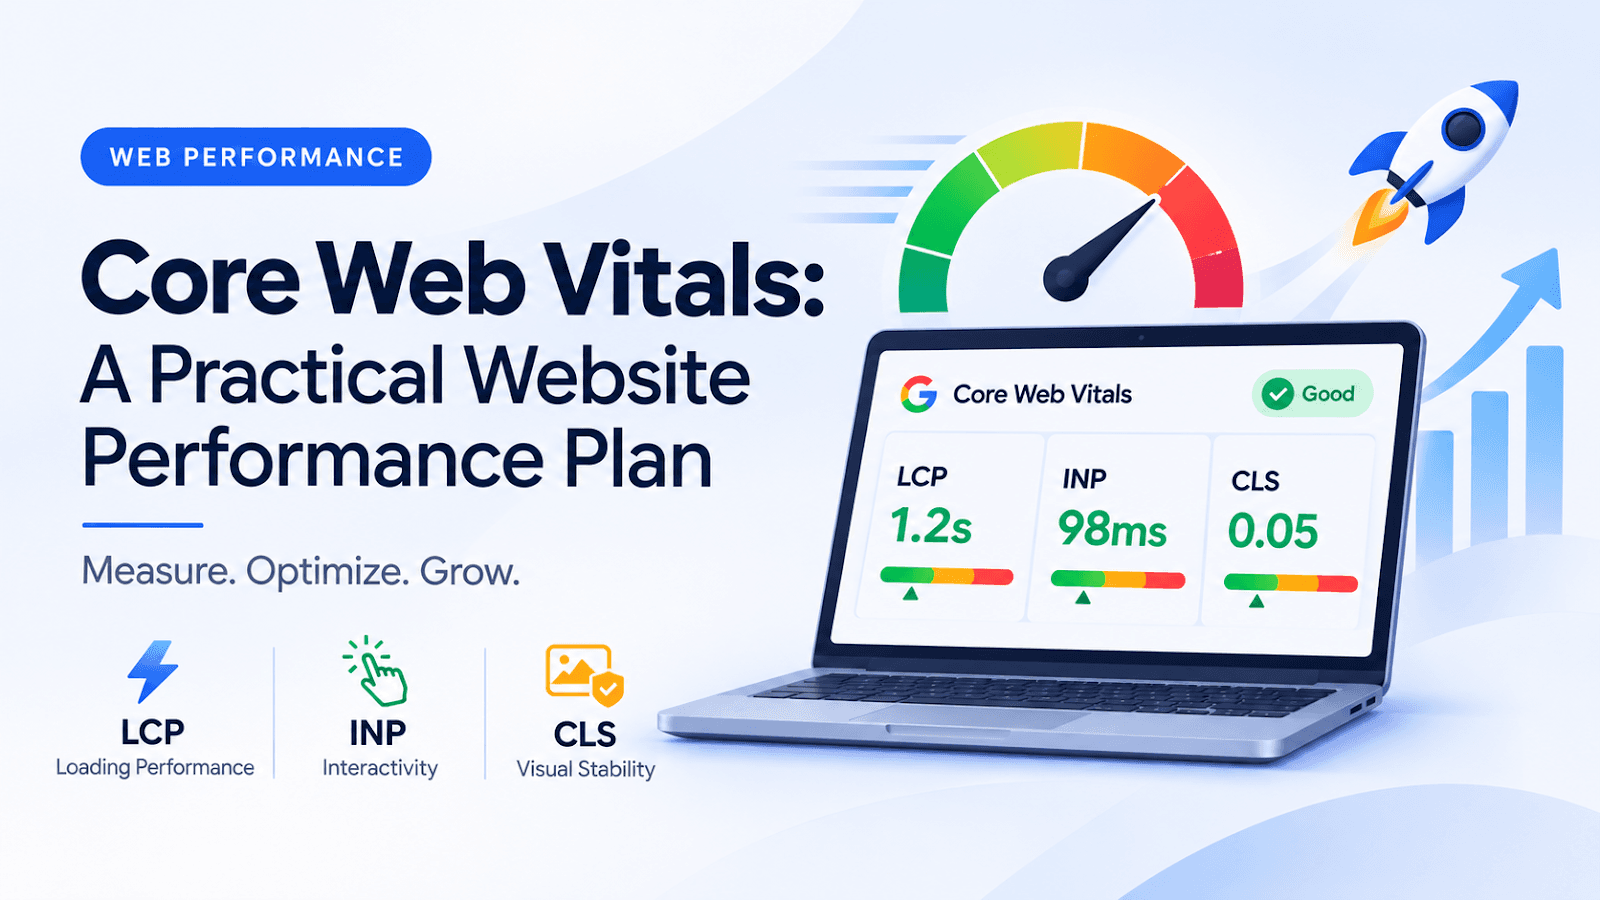
Core Web Vitals: A Practical Website Performance Plan
A website can look polished in a design review and still feel frustrating on a customer's phone. The banner appears late, the menu pauses after a tap, or the enquiry button moves just as someone reaches for it. These are useful starting points for a performance review because they describe problems people actually experience.
Core Web Vitals help a team turn those observations into measurable work. The aim is to make important journeys easier, rather than chase a score without checking the experience behind it.
What Do Core Web Vitals Measure?
Google's Core Web Vitals cover three aspects of the page experience:
- Largest Contentful Paint (LCP): when the largest visible content element finishes rendering.
- Interaction to Next Paint (INP): how quickly the page responds visually to interactions.
- Cumulative Layout Shift (CLS): unexpected movement of visible content.
Google's good-experience thresholds are LCP of 2.5 seconds or less, INP of 200 milliseconds or less, and CLS of 0.1 or less, assessed at the 75th percentile of visits. Field measurements describe real visits; a controlled lab test helps investigate particular conditions. One does not replace the other.
Start With the Pages That Matter
Before changing code, list the journeys that support the business. For a school, that might be finding admissions details and sending an enquiry. For a retailer, it might be opening a product, selecting a size, and reaching checkout.
Choose a small set of representative pages:
- The main landing page.
- A detailed service or product page.
- A form or checkout flow.
- A page reached from a current campaign.
Write down what feels slow, on which device, and at which step. This gives the developer a reproducible problem instead of a vague request to make everything faster.
A Practical Improvement Sequence
1. Review the First Screen
Suppose a property landing page opens with a large building photograph. Ask whether the displayed size needs the original upload resolution. Check the image delivery and loading behaviour before redesigning the entire page.
Avoid changing several unrelated elements at once. A smaller, well-defined change is easier to compare with the previous version.
2. Test the First Interaction
Open the navigation, change a filter, and submit an intentionally incomplete form. Record any delay between the action and visible feedback. A page that appears quickly can still be awkward to use once someone touches it.
3. Look for Moving Content
Watch the page while banners, images, and embedded elements appear. If the enquiry button changes position, record the circumstances and ask the team to reserve appropriate space in the layout.
4. Repeat the Same Journey
Use the same page, device conditions, and actions after the change. Keep a short before-and-after record with screenshots and measurement dates. This makes future regressions easier to recognise.
What Should a Performance Report Include?
A useful report connects technical findings to a page and a task. “The admissions enquiry button moves while the hero loads” is more actionable than “the homepage needs optimisation.”
Include:
- The affected URL and device category.
- The measurement source and collection period.
- The suspected cause and proposed change.
- The person responsible for reviewing the result.
Avoid promising a conversion increase before measuring one. Performance work can remove friction, but enquiries also depend on the offer, content, audience, and form itself.
Final Thoughts
Website performance is easiest to manage as an ongoing maintenance habit. Start with an important customer journey, fix one observable problem, and check the result under comparable conditions. That creates a clearer path than repeatedly rebuilding a site around an isolated test score.
Related Blogs
- The Future of Full-Stack Development in 2026
- Why Modern Software Architecture is Evolving in 2026