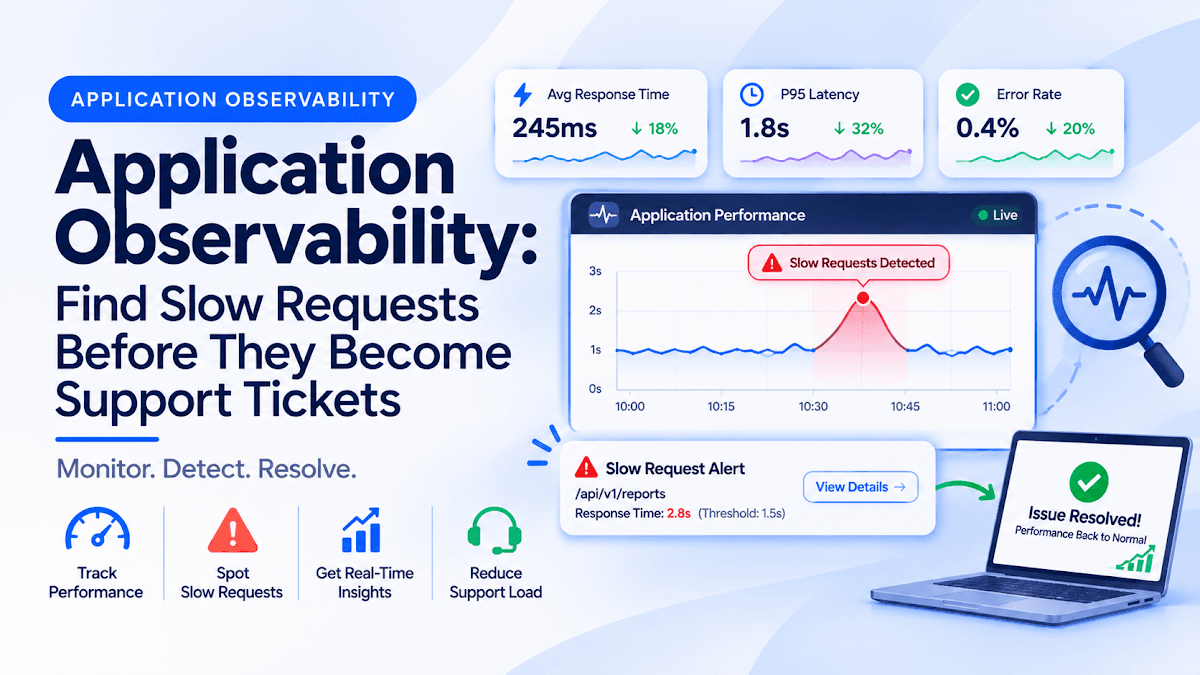
Application Observability: Find Slow Requests Before They Become Support Tickets
The dashboard is loading slowly, but only for some customers. The server is running, the deployment succeeded, and the team cannot reproduce the problem locally. Without a way to follow affected requests, debugging quickly becomes a collection of guesses.
Application observability helps engineers connect a customer's experience to the work happening inside the system. Its value appears during investigation: can the team explain what happened and decide what to do next?
Understand the Signals
OpenTelemetry describes telemetry signals including traces, metrics, and logs. Traces represent the path of work through an application; metrics capture measurements over time; logs record events. Context propagation helps related work retain a connection across boundaries.
These signals serve different purposes. A latency chart can reveal a change, while a trace can help locate time spent inside one request. Logs can provide details about the events associated with that work.
Start With a Customer Journey
Instead of collecting everything immediately, choose a meaningful journey such as submitting an enquiry, loading an account dashboard, or confirming an order.
For that journey, write down:
- What success looks like to the customer.
- Which application components participate.
- Which external services are involved.
- What information a responder needs when it fails.
This creates a manageable scope for instrumentation. A small team can begin with one critical flow and expand as new questions arise.
Design an Investigation Path
1. Notice the Symptom
A useful alert should describe a condition that needs attention. For example, a sustained increase in failed enquiry submissions matters more directly to the business than an isolated technical event with no customer impact.
Choose thresholds from the service's normal behaviour and its agreed expectations. Avoid copying numbers from another product without considering traffic and consequences.
2. Locate the Affected Requests
Provide enough context to distinguish the route, environment, application version, and time period. A deployment marker can help the responder see whether a change and the symptom occurred together, without assuming that correlation proves the cause.
3. Follow the Work
Inspect representative requests to understand where time is spent. A hypothetical dashboard request might wait on a database query, an external reporting service, or a long sequence of smaller calls.
The next investigation should follow the evidence rather than the component the team happens to suspect first.
4. Verify the Recovery
After a fix or rollback, check the same customer-facing measures that triggered the investigation. A healthy process or successful deployment is not sufficient evidence that users can complete the task again.
Keep Telemetry Useful and Proportionate
More data is not automatically more clarity. Agree on field names, retention, and ownership so events remain understandable across services.
Avoid recording passwords, tokens, payment details, or entire customer messages simply because they are available in a request. Decide what is necessary to diagnose the problem and restrict access accordingly.
Review collection costs as traffic grows. Keep enough evidence for the questions the team needs to answer, and document what may be missing from sampled data.
Build a Small Incident Playbook
For the chosen journey, create a short operational guide:
- Where to see the customer-facing symptom.
- How to locate related traces and logs.
- Who owns the affected component.
- Which recovery actions are available.
- How to confirm that recovery worked.
Test the guide with a controlled failure in an appropriate environment. Ask someone who did not write it to follow the steps. If they cannot find the relevant evidence, improve the guide or instrumentation before adding another dashboard.
Final Thoughts
Observability is useful when it shortens the path from a customer problem to an evidence-based response. Begin with an important journey, connect the relevant signals, and make the investigation process understandable to the people who will use it.
Related Blogs
- Reliable Payment Webhooks: Prevent Duplicate Order Processing
- Why Modern Software Architecture is Evolving in 2026
- The Future of Full-Stack Development in 2026